Experiencing a Telehealth Appointment
This content was produced in partnership with Abbott (FreeStyle Libre 14 Day System), an active partner of Beyond Type 1 at the time of publication.
As we all work at practicing social distancing measures, telehealth appointments are a valuable way of getting the care you need while staying at home. Diabetes care and education specialist, Julia Blanchette, uses LibreView, a cloud-based diabetes management system to review continuous glucose monitor (CGM) data coming from the FreeStyle LibreLink app being used by T’ara Smith, the project manager of Beyond Type 2. Watch the appointment below!
Partial transcript below, edited for content and clarity
Julia Blanchette: So T’ara, tell me about how things are going for you. Have you had any significant changes to your schedule or your diabetes management since the COVID-19 outbreak?
T’ara Smith: Before the COVID-19 outbreak, I felt like I was on a roll. I had just started an insulin pump and I was going to the gym every day, and my blood sugars were really getting to where I needed them to be. Then the outbreak happened, and it flipped everything on its side. I’m not exercising as much and though, my diet hasn’t changed as much, I have eaten a bit more junk food than recently. So, I am starting to see those elevated levels of blood glucose. Of course, the stress and anxiety from COVID-19 sometimes put diabetes to the back of my mind instead of the forefront where it should be.
JB: I think what you’re going through, a lot of us with diabetes are experiencing right now. I think it might be a good idea to take a look at some of your data to see what we can do to help you reevaluate your goals for your self-management during this time and see how I can help you reach them. Let’s pull up your Libre data on LibreView.
A Look at the Positives
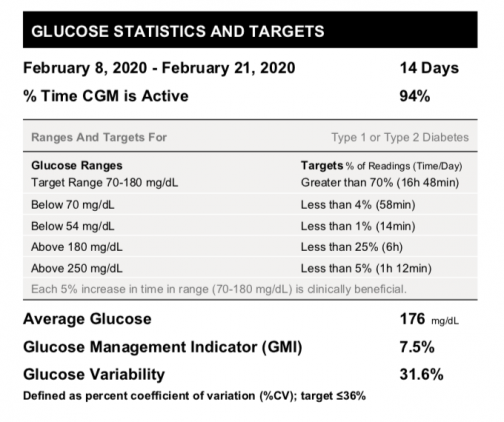
JB: The first thing we’re going to do here is to look at the percent time your CGM was active and collecting data. Your data shows you’re capturing data 94 percent of the time.
T’ara, what do you feel went well over the past couple of weeks for you? I know you said it’s been a tricky time. It’s been a tricky time for everyone, just because of all the changes to our lives. But what do you think has been going well with your diabetes?
TS: I’m still been able to get the insulin I need, and that I still have my pump supplies. I’m still using my CGM on a regular basis and putting in as accurate of carb counts as possible. I’m still exercising; I may not be going to the gym, but I’m still going for walks every day. So that really gives me some things to be proud of with my diabetes right now. Also, I’m still finding ways to eat relatively healthy. I’m still probably eating a bit too much junk food than normal, but I haven’t stopped eating vegetables or fruits; I still have at least a piece of fruit every day, and I still try to work in something green at least once a day, every day. So those are still some things that work for me.
JB: That’s fantastic. It sounds like you have a lot of positives, a lot of bright spots right now. And that’s what I love to hear, that you can find a lot of positives. What I really liked that you touched on is that you are still figuring out creative ways to exercise, so I think that’s great. I think creativity right now, which it sounds like you are using, is so essential to making sure that you feel well, and that we’re able to still help you manage your diabetes. So congrats on everything you’re doing! Also, if I were looking through your insulin pump data, it would be incredibly helpful for me as a provider to see. I would be able to see if your insulin to carb ratio needs to be changed or not.
Breaking Down the Data: 
Julia takes a look at T’ara’s data and goes over some important indicators to look for in LibreView reports such as the time-in-range, the glucose management indicator (GMI), and glucose variability.
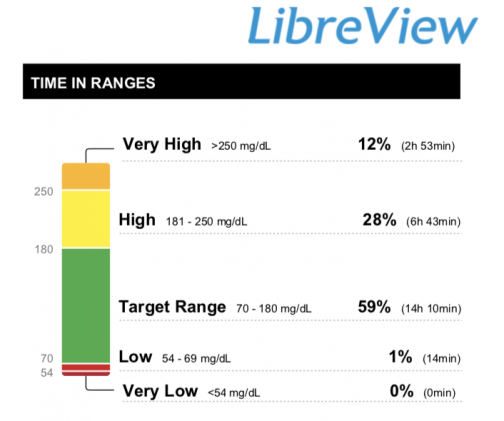
JB: Let’s look at the data and focus on the green section, which shows that the preferred range is 3.9 to 10.0 mmol/L70 to 180 mg/dL. We use this range because 3.9 mmol/L70 mg/dL is considered low blood sugar or hypoglycemia. So, we want you to stay above 3.9 mmol/L70 mg/dL. And then the reason why we have 180 here as the higher end is that when you eat food, or when you’re stressed or anything like that, your blood sugar will go up throughout the day. And that’s totally normal, even for people who are taking insulin. But the reason why 180 is that higher-end is because the American Diabetes Association targets for two hours after you’re finished eating a meal are to have a blood sugar below 180. So, we know you’ll go up, but the goal is, two hours later after you eat, to be below that 180. Anything higher would be in that hyperglycemia range for the purposes of the CGM reports.
Now the goal for your time-in-range? It depends on your A1C goal. So, if your A1C goal is less than 8%, the goal time and range are greater than 50%. And then if your goal A1C is under 7, the goal time and range is 70%. You’re doing great! You’re at 59% which is great for baseline. Another point is that you’re only below 3.9 mmol/L70 mg/dL one percent of the time. Depending on your goal, this is fine. But as we look through your data, we can find solutions to minimize that.
TS: That’s something I definitely want to do. Sometimes I’m afraid of going low at night, so I sometimes eat something at night to run a little higher to prevent a nighttime low.
JB: That’s so insightful and I’m happy to hear you’ve thought of some of the roots of that. The fear of night lows is one we hear a lot. But when I look at your report, I see you’re staying high from 3 P.M. and on. We could take a look at this together and see if you need insulin changes or other things such as if when you’re eating at that time of day is balanced. For people with type 1, it has something to do with needing insulin adjustments.
TS: If I were someone with type 2 and you saw the same data, what could be some of the reasons for that?
JB: That’s a really great question. With the reports with people with type 2, when I go to the day-by-day report, sometimes I see less variability. And the blood sugar’s not going to be 100 percent flat line. You will see up and downs, but a lot of times it’s not swinging super low and then up, like people who are having low and high blood sugar. This is specific to people who are not on insulin.
So, if they’re not on insulin, you’re not going to see those swings as much, usually. Usually. And so, a lot of times when I’m going through reports of people with type 2, if they’re on oral medications and they’re already on a dose that their prescriber thinks is right for them, we can talk about, “Are you stressed? What are the ways that we can cope with that? Are you able to go on walks throughout the day, or move around a little bit? And if you do, that might help minimize some of this.”
I always use the food plate and I like people to pick out what they want to eat themselves and what works for them. But I always just they should try to fill it with half non-starchy veggies, and then a quarter of it with their protein of choice and then a quarter with their carbohydrate of choice. And that method to help balance out works pretty well with a lot of people with type 2 when you’re seeing those spikes at meals specifically on these Libre reports.
 JB: With that said, we’re going to take a closer look at your day-by-day reports. But before we do that, I want to look at your average blood glucose. Below it, you’ll see the glucose management indicator (GMI), which takes the average blood glucose based on your CGM readings. It predicts what your A1C would be. It’s not always 100 percent accurate, but it is based on this data. I also look at blood glucose variability [the changes and swings in blood glucose levels]—which you’re doing great with—you want a target of below 36% [and you’re at 31.6%].
TS: Wow! I am happy to learn I’m doing well with my glucose variability. I’m always worried about complications and if the variability in my blood glucose would contribute to that. Seeing I’m below target empowers me to continue to make even better decisions in my management.
So, if I’m thinking about this correctly, this makes it all more important that we have 94 percent of CGM data. Because at 94 percent makes the average glucose, the GMI factor, and variability numbers more reliable. You can rely on those numbers more because we have 94 percent of that data.
JB: Exactly! And as someone who is a self-proclaimed statistics lover, because I do research, it’s really important to have accurate data. So that’s why, yeah, the first thing I did was I looked at, “Okay, is she wearing,” or not wearing necessarily for you, but scanning frequently enough to capture most of the data? Because if you’re not, I’ve seen reports where they only have 20 percent captured data. And then you can’t really look at the average glucose or the glucose variability, and then you don’t really see patterns because you get breaks in the graph lines, which means not everything’s captured. We want it to be accurate and we want to help you.
Analyzing Average Daily Glucose
Julia and T’ara analyze the average glucose on a specific day in T’ara’s report. In this section, they discuss possible reasons that contribute to T’ara’s numbers.
JB: Let’s take a look at your day-by-day reports. Your summary data shows how often you’re scanning and your average blood glucose for that day. This summary is really important because it shows how many times you’re scanning. It also gives the average blood glucose of the day too, which could be very cool if I wanted to see, “Oh, are you higher on Saturdays and Sundays because your schedule is different than weekdays?” And you’d be able to see that reflected here as well.
My favorite part of the report is actually looking at the daily logs because I think it’s kind of like putting pieces of a puzzle together, trying to figure out not only what happened, because there are so many factors that impact blood sugar, but a lot of times when you talk to patients about what we’re seeing on these daily logs, they learn a lot and they reflect on a lot of their own self-management.
Can you tell me about February 8th? Your average blood glucose for this day was 9.9 mmol/L178 mg/dL. What patterns do you see?

TS: I noticed from noon to about 3:00 is when my blood sugar is mostly in range. And looking at, this is on a Saturday, so my schedule is definitely different here than possibly a workweek schedule because I typically don’t eat between 12:00 and 3:00. I may not have anything to eat until later in the afternoon, closer to that 4:00 or a little bit after 3:00. And also, usually in the early afternoon is when I’ll start walking the dog, so I’m taking longer walks, which is contributing to the decrease in my blood glucose.
JB: Are these dips here, you think at this time when you’re walking the dog or after you’re walking the dog?
TS: Yes.
JB: What do you usually do before you exercise or do some physical activity? Do you do anything different with your diabetes management?
TS: I usually keep my basal rate the same. I don’t really make any major changes to that.
JB: If you found that you did drop each time you went for a walk, there’s a couple of options. One, you could have about 15 grams of carbohydrate, I always say a bar that has some protein in it, too, not just pure carbohydrate, before you go on the walk. Or, you can use a temp basal [on your insulin pump] if that’s what you decide is right for you with your healthcare provider. You can decrease the basal, but you’d want to start that at least an hour, an hour and a half before you go on the walk, so there’s time for it to help actually reduce what’s impacting your bloodstream when you’re walking.
For insulin-dependent type 2s who take injections, you and your healthcare provider would discuss adjusting insulin and other medications for mealtimes and other parts of the day, if necessary. Also, I can detect where stress impacts blood glucose levels on reports. So, it’s important to talk about creating a plan that can keep you safe with respect to your schedule. This includes looking at what you’re eating and making sure you’re eating in a balanced way.
What to Expect at the End of the Appointment
Julia and T’ara begin to wrap up their telehealth appointment. In this section, Julia asks T’ara what she thinks she can do to improve her own diabetes self-management.
TS: At the end of the appointment, what would you recommend to a patient, whether they have type 2 diabetes or type 1 diabetes, what are the next steps?
JB: Throughout the appointment, I jot down notes about what we’ve identified and at the end, reemphasize everything we learned from looking at your daily logs and overall data. Then I’d ask you, “What do you want to work on over the next couple of weeks?”
TS: That’s great! I want to work on getting those evening highs down and figuring out what’s going on with me at that time. Am I eating too late? Am I exercising at that time and then trying to make up for that exercise by eating, so that way I don’t drop low at night? Do I have a fear of hypos? For me, I would go home and pay more attention to my behaviors in the late afternoon and evening, because I’m seeing that’s where the rise starts.
JB: Do you think it would be realistic for me to have you journal each day to check in with yourself and to see what’s happening at that point in time for you?
TS: For me, it would be realistic, because I use my phone to capture my Libre data. And when you scan, you can add in some notes in the LibreLink App. So, since I’m already on my phone, I can just scribble down some things, some key things I would remember. I think when it comes to journaling, we think of it as long, drawn-out sentences. But it doesn’t have to be that; it’s just key things that will remind you of what’s going on at that time. So, when you look back, you know exactly what’s going on.
JB: That’s a great idea! Do you think this was helpful? Do you feel like you’ve learned a lot?
TS: I do. I really love learning about the GMI that predicts your A1C. I think a key takeaway here is knowing the importance of having as much data as possible and getting in that at least once every day hours scan. And to know that the more data that your provider has, the better that they can help you, and also the better that you can help yourself. Because especially if you’re only going to the doctor once every three months, this is a great tool. LibreView is a really great tool to be able to see everything in one sitting. And also, if you’re using LibreView, you can see two weeks’ worth of data, up to 90 days worth of data in one sheet. You have options to be able to look at your data holistically.
And you can be your own care specialist, because as a person with diabetes, whether you’re a type 2 or type 1, you are still the number one person on your care team. And the great thing about having something like LibreView is that you have the data to empower yourself, and you can see those trends. And I think with telehealth specifically, being able to go through this data with you, Julia, it makes me feel like a partner in my own care. Us going through the patterns and then having you ask really good questions gets me to think more and deeper about my diabetes management.
JB: I’m so glad! As diabetes care and education specialists, we hope to empower you. It’s your diabetes, and we’re on your team, and we want to help you reach your goals.


